If you have patience and space, it's surprisingly fun
Unlike desktop operating systems, iOS and iPadOS offer no native ways to look into the processes running on the iPhone and iPad. The App Store is also devoid of apps that can help you check your device’s inner workings.
However, if you have access to a Mac, you can view a list of processes running on your iPhone or iPad. You just need Xcode.

Installing Xcode on Your Mac
Xcode is an integrated development environment (IDE) that aids software creation for Apple devices. It features a tool called Instruments that you can use to view a list of processes running on your iPhone or iPad. You don’t have to be a developer—or even pay—to use it.
Xcode is available as a free download on the Mac’s App Store. However, you must have a Mac running macOS 11.3 Big Sur or later to download and use it. An Xcode installation also requires at least 12GB of bandwidth and disk space, so you may want to free up storage space on your Mac before going ahead.
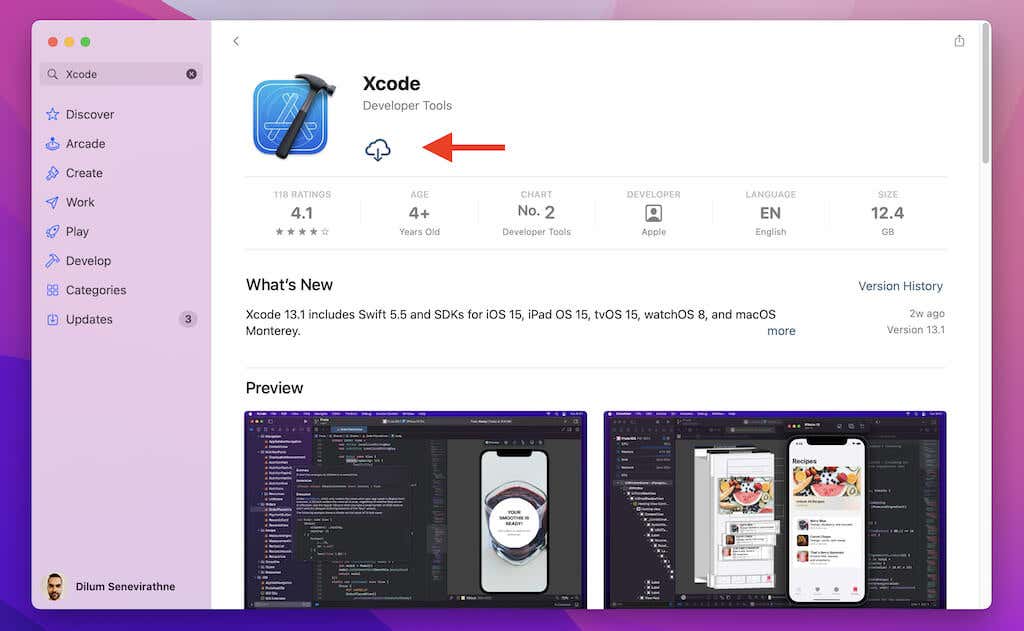
Open the App Store, search for Xcode, and select the Get or Download button to install Xcode. Depending on your internet connection’s speed, that can take a couple of hours or longer.
Setting Up Xcode Instruments
Once you’ve downloaded and installed Xcode, go through the steps below to view a list of processes running on your iPhone or iPad.
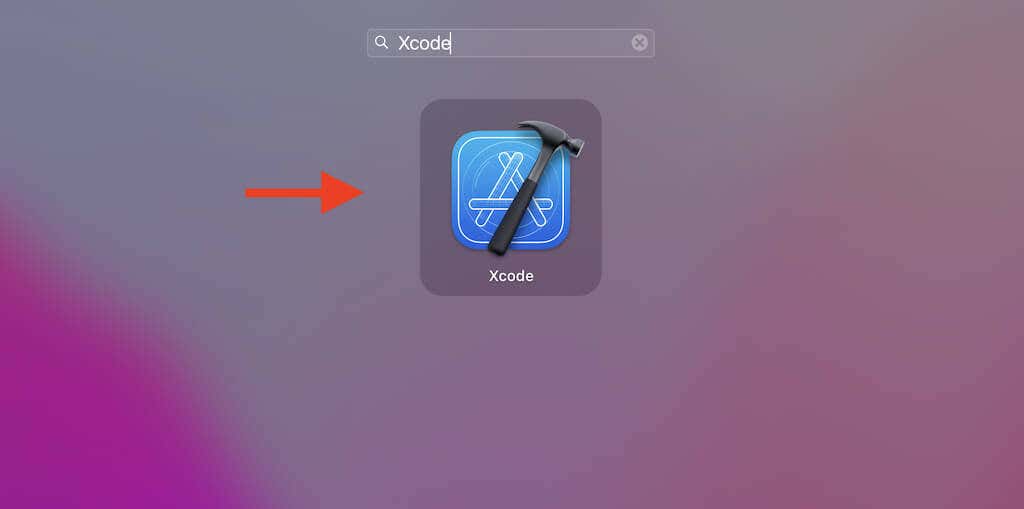
1. Open the Mac’s Launchpad and select Xcode.
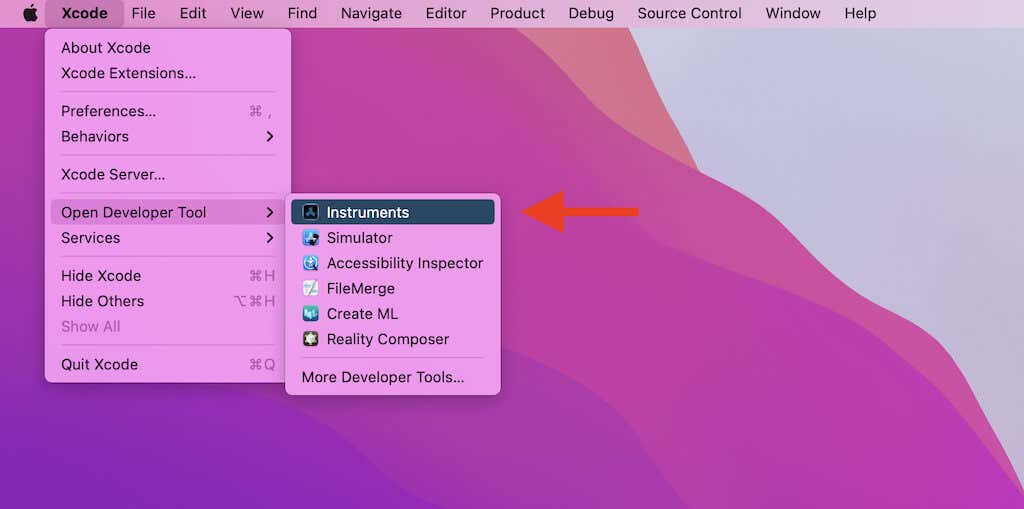
2. Select Xcode on the Mac’s menu bar, point to Open Developer Tool, and pick the option labeled Instruments.
That should load Xcode Instruments. It’s a performance analyzer and visualizer that lets you record an iPhone or iPad’s CPU-related activity (as well as a host of other stuff we won’t be covering here).
3. Connect your iPhone or iPad via USB to your Mac. Then, unlock the iOS or iPadOS device and tap Trust (if you haven’t previously connected it to the same Mac).

4. At the top-left of the Instruments window, open the menu next to Choose a profiling template for. Then, point to [Your Name] iPhone or iPad and select All Processes.
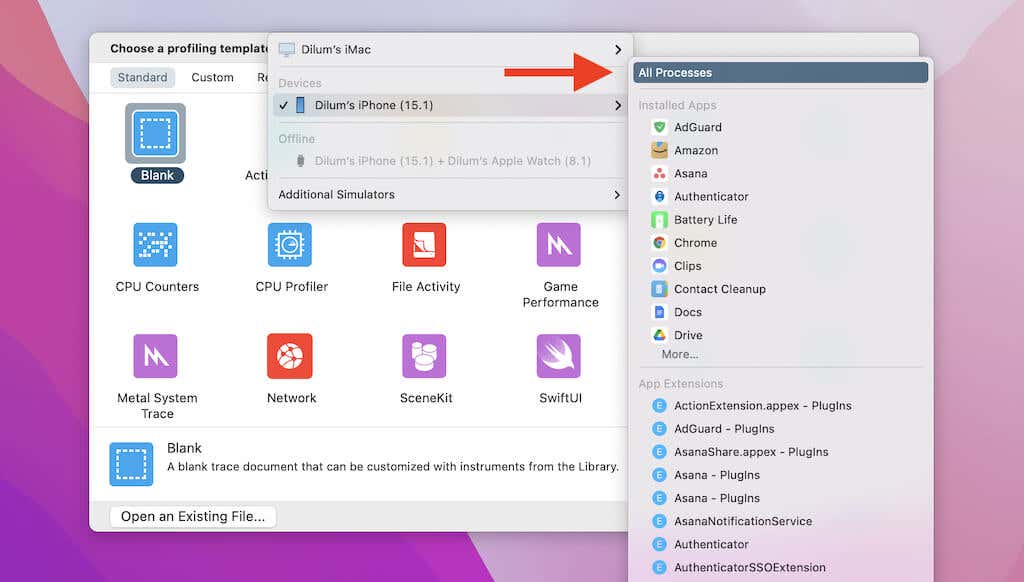
Note: If your iPhone or iPad appears grayed out or “Offline,” disconnect and reconnect it to your Mac. If it continues to appear that way, remove the device, restart your Mac, and repeat the steps above.
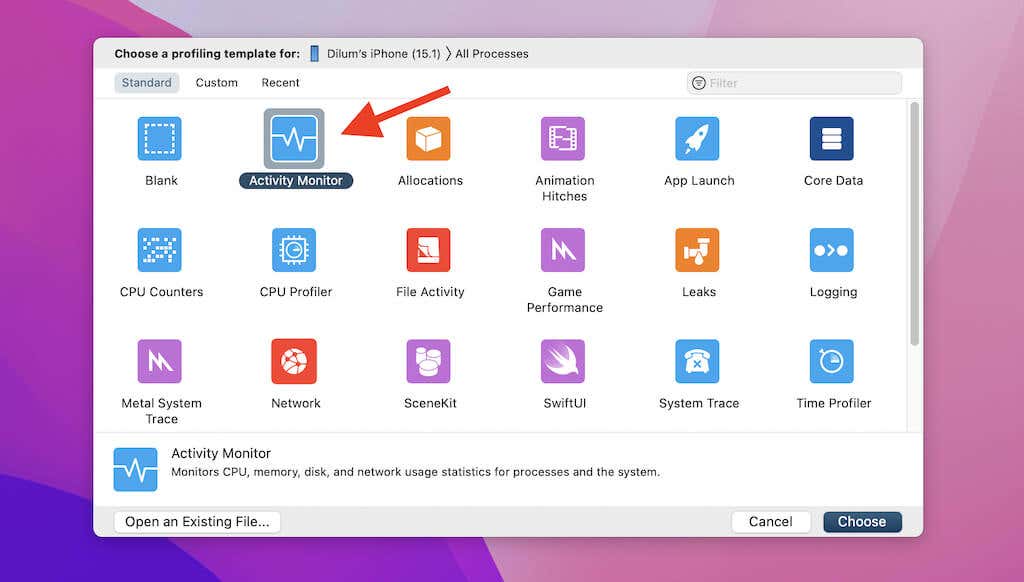
5. Pick the icon labeled Activity Monitor and select Choose.
6. Select the Record button at the top-left corner of the window. That should prompt Instruments to record and display your iPhone or iPad’s CPU activity.
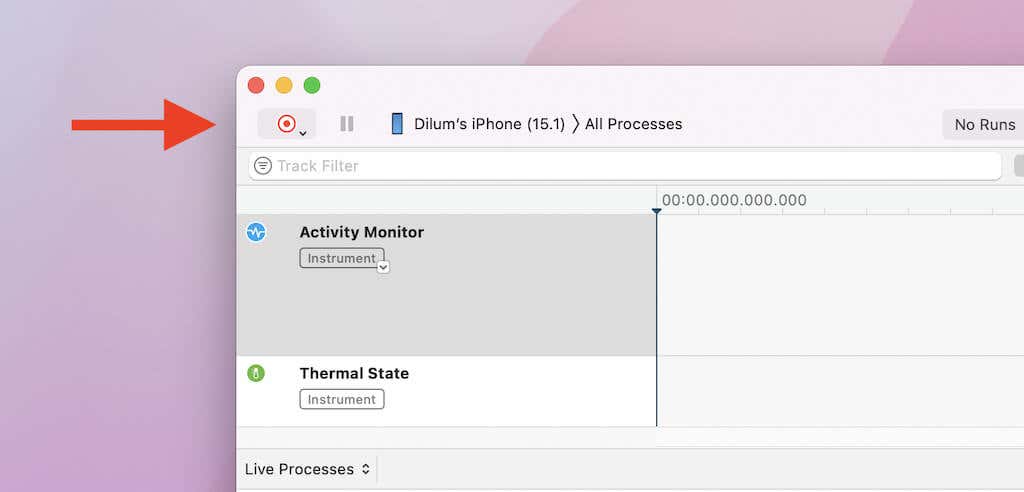
Note: Instruments may appear to freeze as soon as you select the Record button. That’s normal behavior and usually lasts for up to a minute.
Viewing Processes in Xcode Instruments
The Activity Monitor in Instruments will display your iPhone or iPad’s CPU load in a visual format, along with a list of running processes toward the bottom of the window. If you don’t see the latter, press Command + 1 to switch to Live Processes.
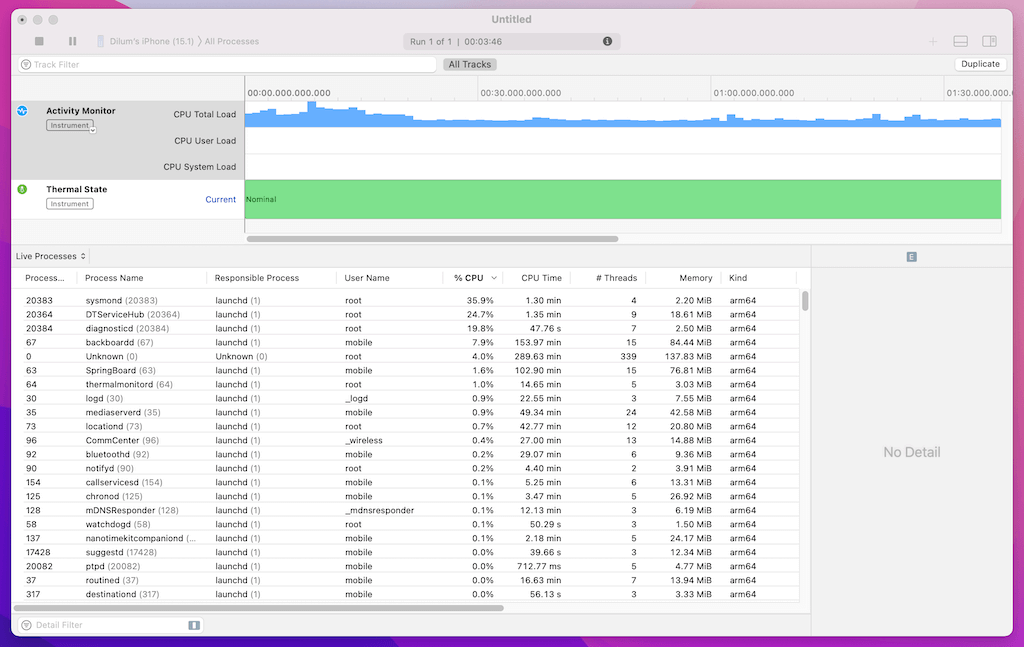
The Process ID and Process Name columns help you distinguish between processes. Additional columns such as % CPU, Memory, and CPU Time lets you determine CPU usage, memory consumption, and the total runtime for each process. You can sort processes by selecting the appropriate column. For example, if you want to check the processes that consume CPU resources the most, select the % CPU column.
The majority of the processes are cryptic and reflect core system functionalities in iOS and iPadOS. For example, bluetoothd is the process behind the Bluetooth daemon, which is the component that handles Bluetooth devices. If you want to identify or learn more about a specific process, Google is your friend.
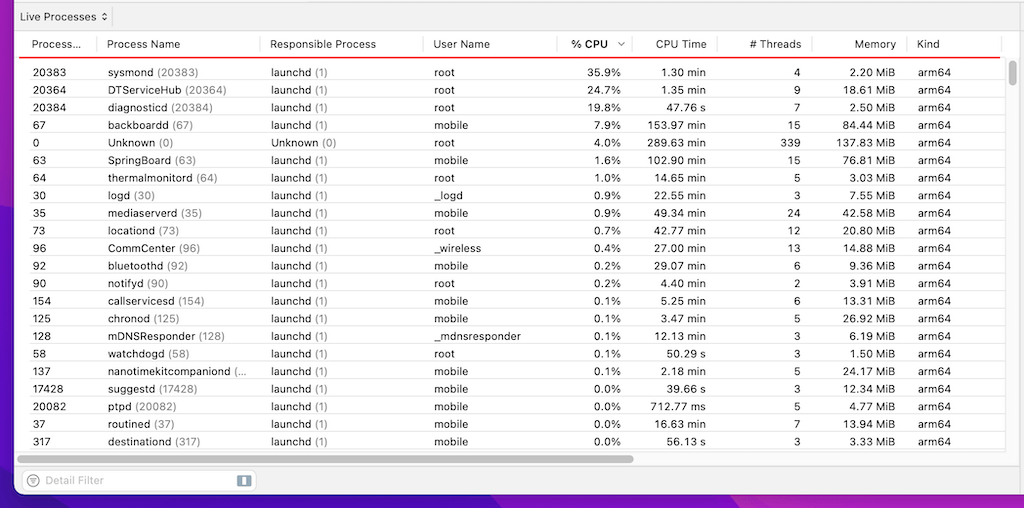
However, you’ll quickly recognize a few, such as the apps that run on your iPhone or iPad—e.g., Firefox is the primary process associated with Mozilla Firefox.
Start using your iOS or iPadOS device, and you will see the CPU and memory consumption spike for related services and apps. Force-quitting apps (more on that later) will remove the relevant processes from the list.
You can also monitor a specific process by control-clicking and selecting the Add [Process] as a Detail Filter option. Or, you can input multiple process IDs (look at the Process ID column) into the Detail Filter box at the bottom-left of the window to view them separately from the rest of the processes.
![Add [Process] as a Detail Filter option](https://www.switchingtomac.com/wp-content/uploads/2021/12/10-Add-Process-to-Filter-copy.png)
Once you’re done checking the processes on your iPhone or iPad, select the Stop icon at the top-left of the Instruments window. You can then choose to save the recorded activity (File > Save As) before exiting Xcode.
Troubleshooting an iPhone or iPad
Using Xcode to view a list of processes running on an iPhone or iPad can also help you troubleshoot your device. For example, if you experience regular freezes and crashes, you just might be able to spot the app or system service behind the problem. You can then perform the following fixes on your iPhone or iPad to resolve common issues.
Force-Quit Apps
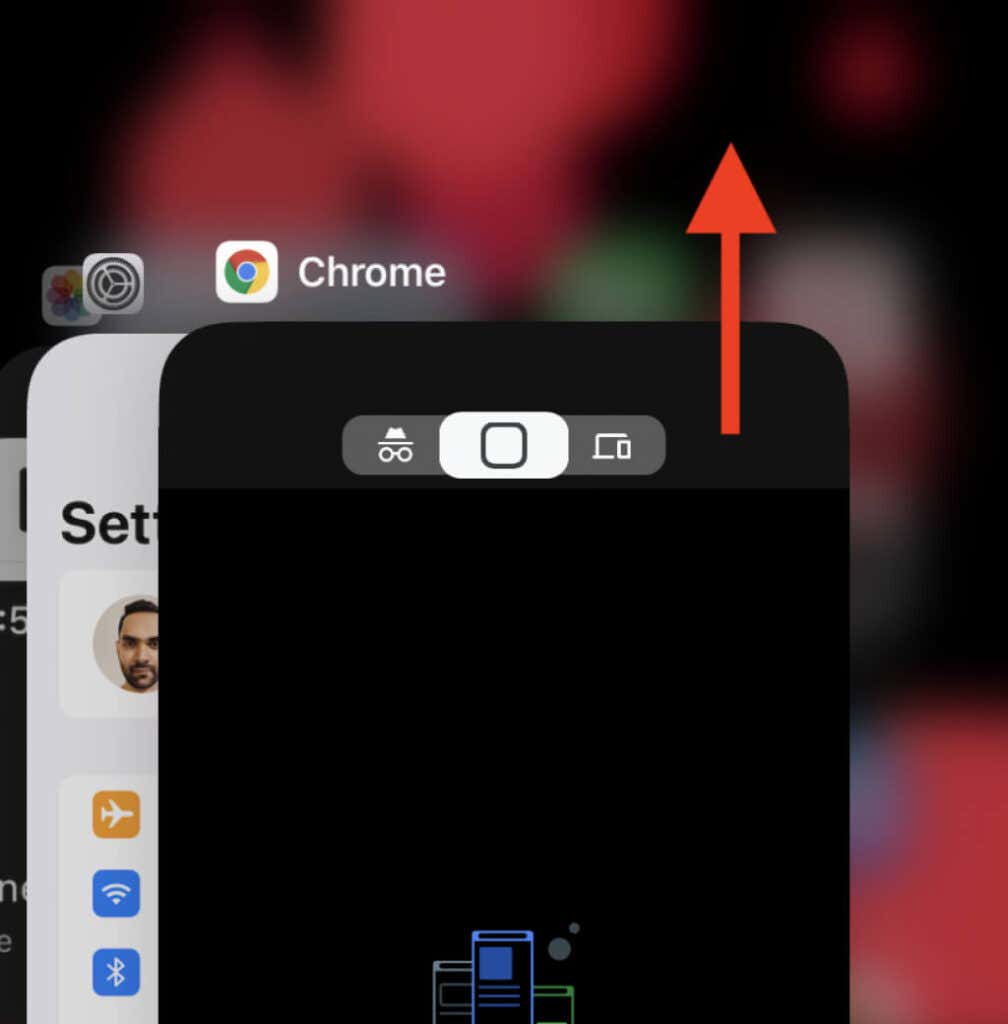
If an app always appears to max out the CPU, memory, or both, your first course of action should be to force-quit. To do that, open the App Switcher (swipe up from the bottom of the screen or double-click the Home button) and remove the app from the screen.
In Xcode Instruments, you’ll notice that the action effectively shuts down the relevant process. Follow by relaunching the app from the Home Screen.
Update Apps
App updates come with loads of bug fixes and performance enhancements. If the problem persists, open the App Store and search for the app. If there’s an update, you’ll see an Update button that you can tap to update it.

Disable Background App Refresh
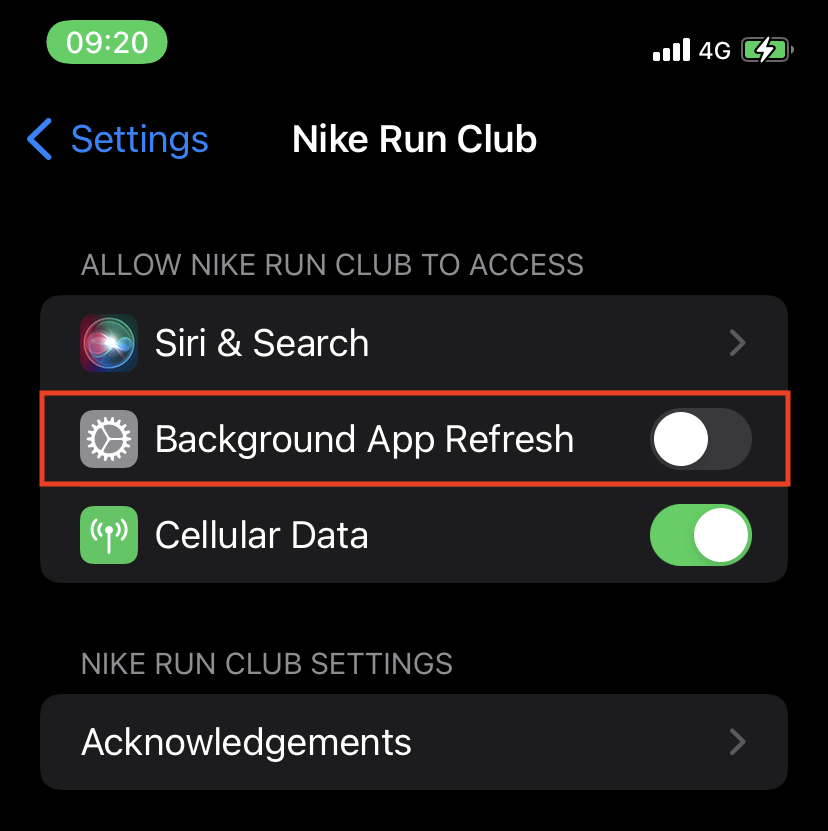
If Instruments shows an app using lots of CPU resources and memory even when you aren’t actively using it, try stopping it from running in the background.
To do that, open the Settings app, scroll down the screen, select the app in question, and turn off the switch next to Background App Refresh.
Restart iPhone or iPad
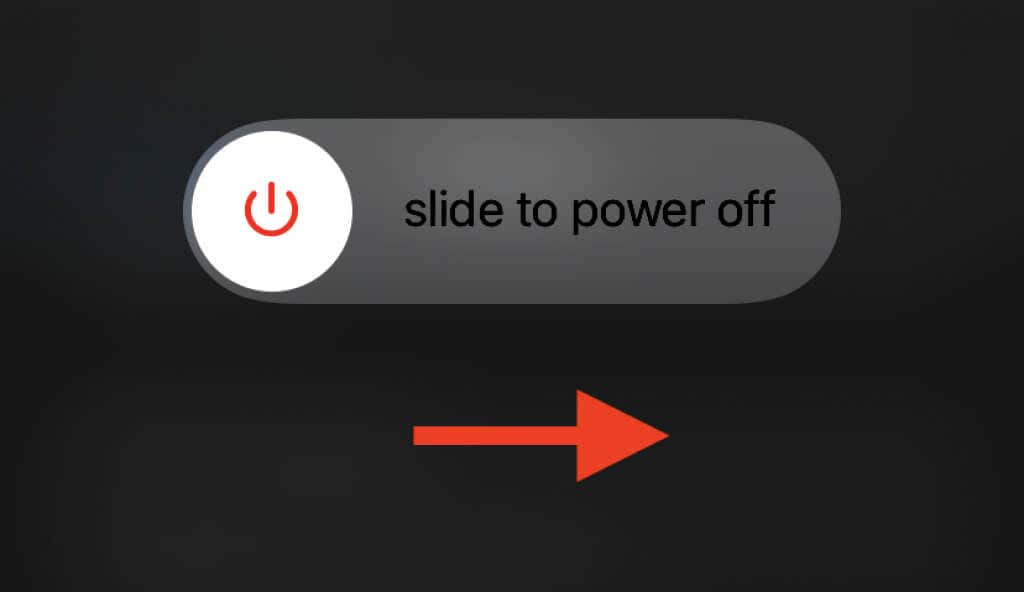
Restarting an iPhone or iPad can fix rogue system processes and memory leaks. For example, if Xcode Instruments displays very high CPU or memory usage for multiple apps and system processes (with no explicable reason), open the Settings app and select General > Shut Down to turn off the device. Then, wait for 30 seconds and hold down the Side button to reboot it.
Update the System Software
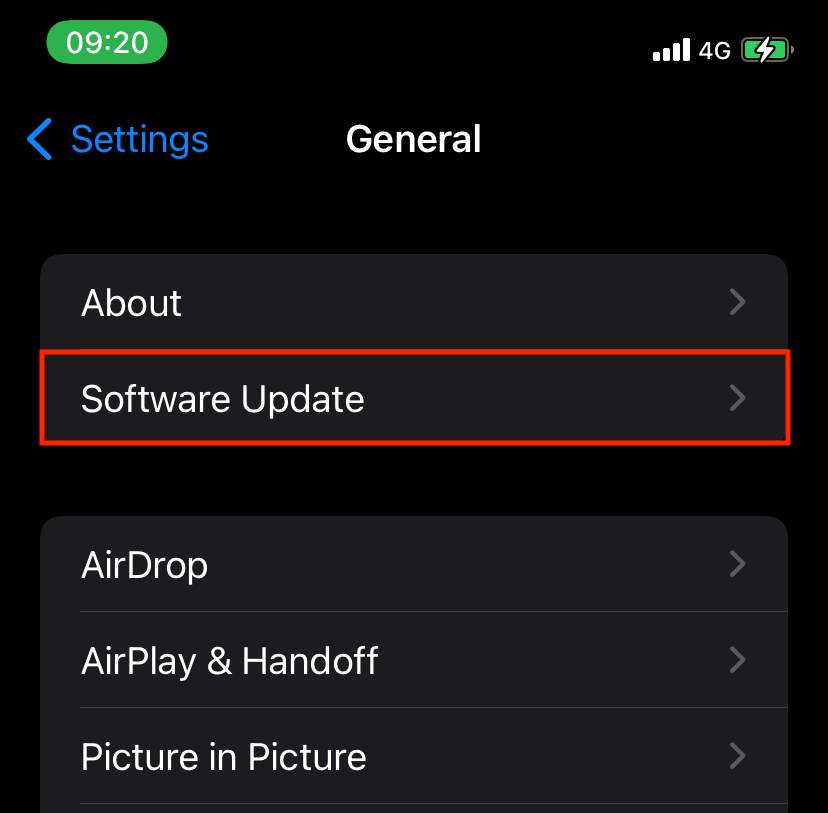
Updating iOS and iPadOS fixes issues with the system software in general. If you’ve yet to update your iPhone or iPad in a while, open the Settings app and select General > Software Update to check for and install the latest updates. If you run into any issues, learn how to fix stuck updates on iPhone and iPad.
Reset All Settings
Resetting all settings on your iPhone or iPad resolves issues caused by conflicting settings. If Xcode Instruments continues to display high activity, open the Settings app and select General > Transfer or Reset iPhone > Reset > Reset All Settings.
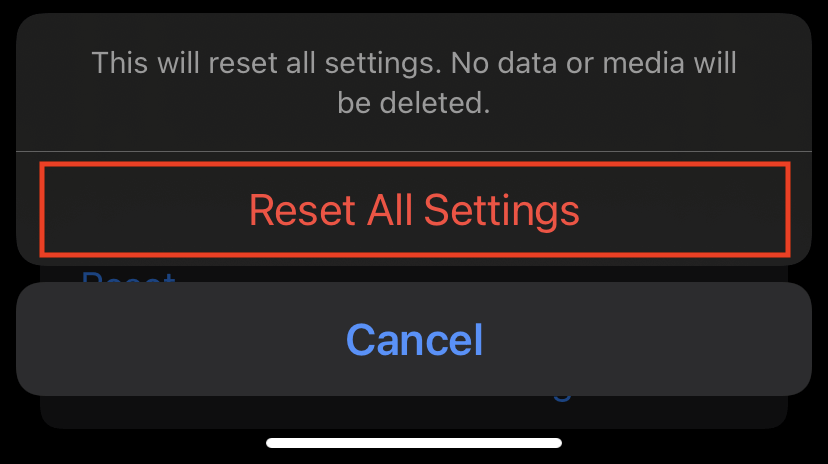
If that doesn’t do anything, the next logical step is to erase and reset your iPhone or iPad to factory defaults.
Inner Workings
Xcode provides a great window into the list of processes that make your iPhone or iPad work and even helps with troubleshooting. Admittedly, setting up the IDE on your Mac is time-consuming and requires a substantial chunk of disk space. But if you have the patience and the storage to spare, it can be a surprisingly fun exercise.


